
Enterprises worldwide are striving to have applications that are both robust and responsive. So, their technology teams are exploring ways to achieve that through improved Performance Testing. There are different kinds of performance tests to ensure the program’s speed, scalability, and stability aren’t compromised under any browsing condition.
Two of the most common goals for any Performance Testing activity are to measure Server Response Time and Render Response Time. Before going into any details about Server Response Time and Browser Performance or Render Response Time, let us try to understand Static Resources.
A web page or an application is usually a composition of Static and Dynamic Resources. Dynamic resources are assigned to a path of the network and they will not even exist until runtime. But Static resources are hard-coded into the program so they can be transmitted in a simpler and more resource-efficient way.
Statics resources are something that does not get modified very frequently like the HTML content and any other user-specific data.
Here are a few examples of the Static Resources:
- JS files
- CSS files
- Images
- WOFF files
- ICO files, etc.
How to recognize or view the Static Resources of a page?
Try to access any website in your browser after turning on developer tools (Network sub-option) and you will notice there are a lot of responses sent by the server to the end-user. However, if you recall you just enter only one URL in the browser (for example, try www.qenteli.com).
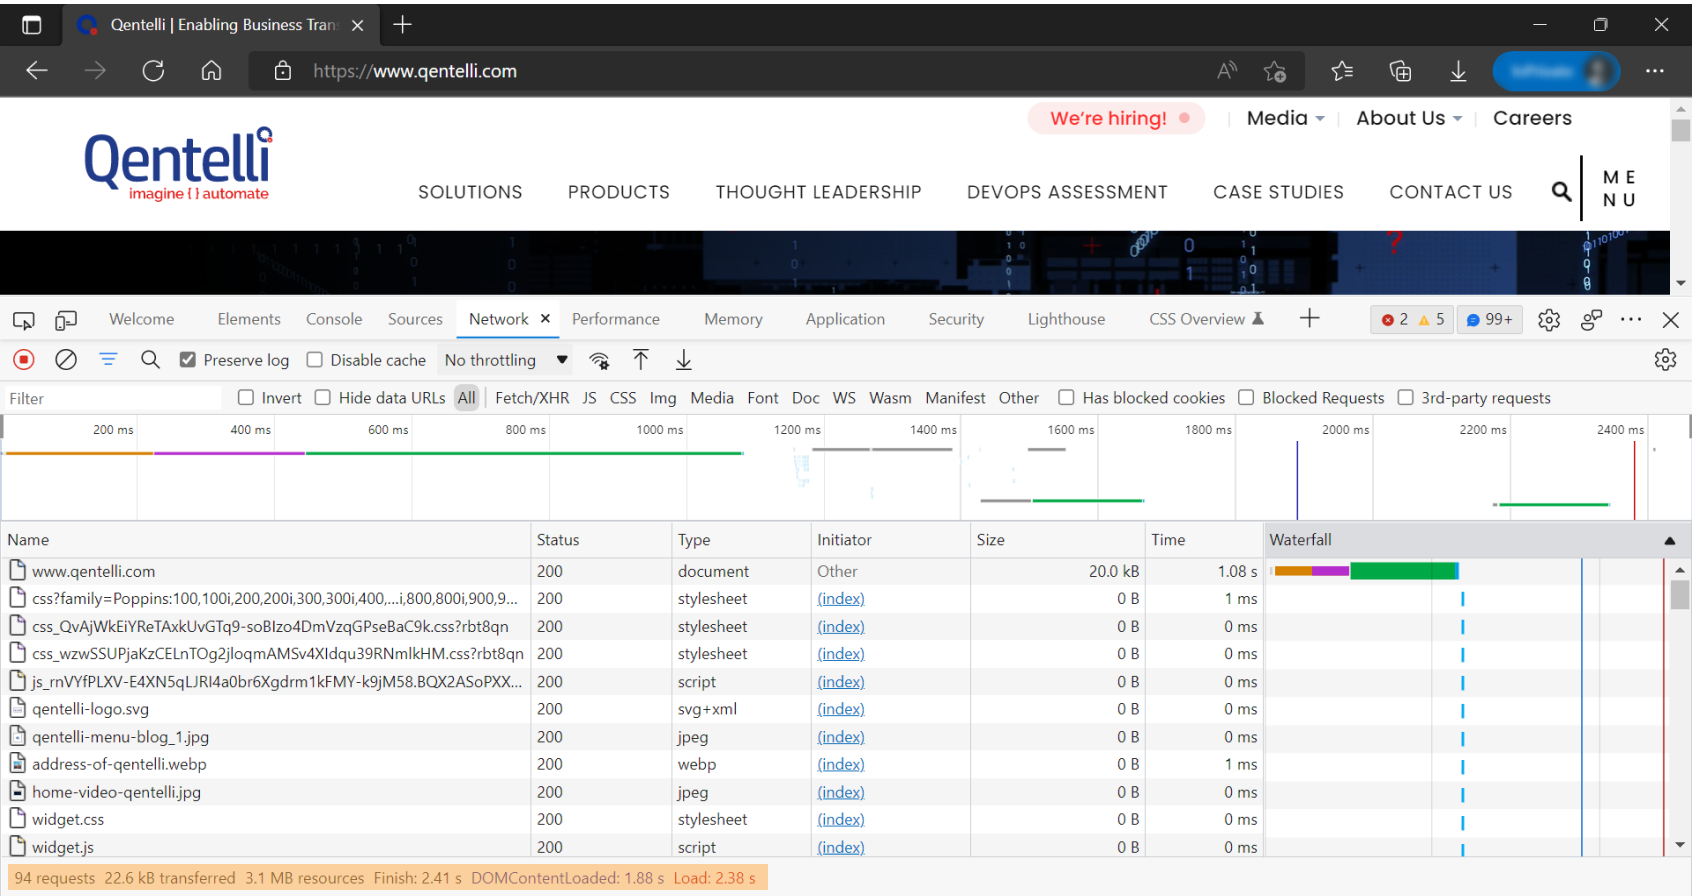
In the above example image, I opened the browser and went to www.qentelli.com. However, if you look at the bottom of the image it has about 100 requests, and if you read the ‘Name’ column it has .CSS, .JS among some other files.
This is how a standard web page works
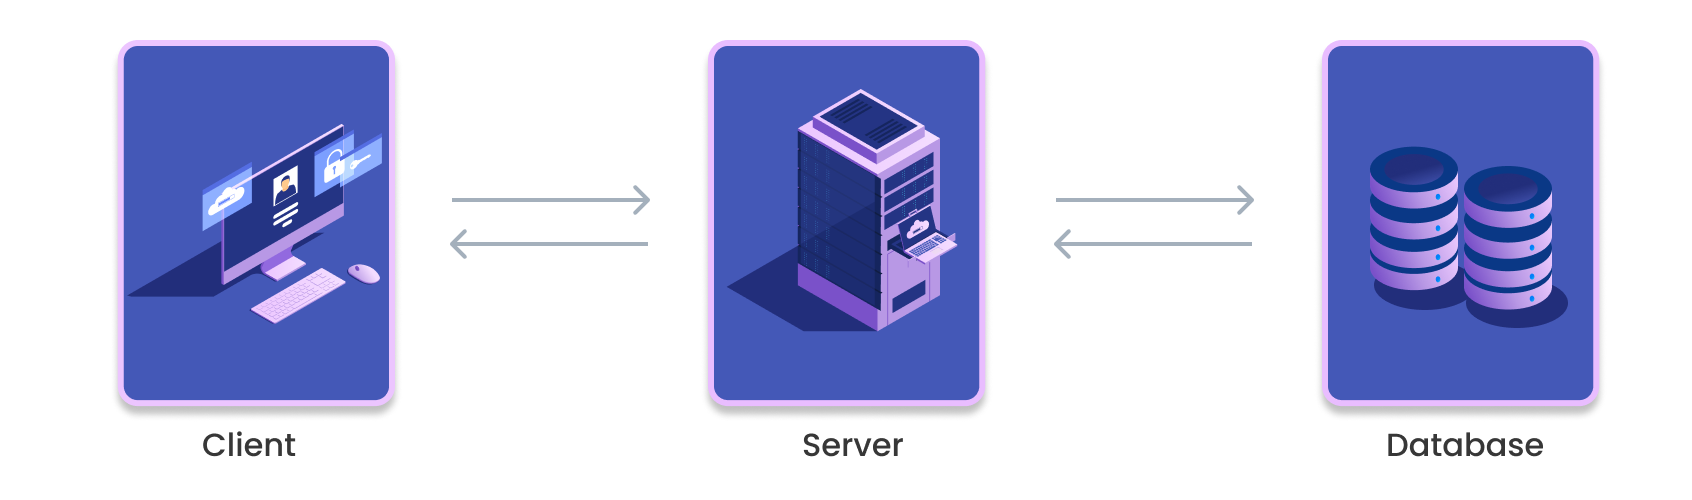
As soon as the user hit www.qentelli.com, the user request will travel over the network and reach a web server. The web server will respond back to the user with HTML which will have a lot of other calls.
Note: Web server will connect and get the data from DB only if that request needs. For example, on the ‘Careers’ page, if you try to filter the open positions or submitting your resume, etc.
As soon as your browser gets the 1st response of accessing www.qentelli.com, it will start doing the below activities.
- Begin Constructing the DOM by Parsing HTML
- Request CSS & JS
- Parse CSS & Construct the CSSOM
- Execute JS
- Merge DOM & CSSOM into Render Tree
- Run Layout & Paint the page
As far as Static Resources are concerned, we will be focusing only on what happens in steps 1 & 2.
As soon as the browser gets an HTML page request, it will read it and sends that request to the server for all Static Resources (like JS, CSS, images, etc.) which will then be transmitted by the server back to the end-user. All the Static Resources get downloaded only once during the entire journey from server until the user performs the ‘Clear cache’ operation. Until the Cache is cleared, the request need not go to the server. Instead, it fetches from the browser’s cache memory.
Categorizing the Browser and Server activity
Server activity – Monitoring all the incoming requests and their respective responses sent back to the end-user by the server is Server activity. We also consider this activity to calculate the Transaction Response Time or Server Response Time.
Browser activity – Once your browser downloads the required file, it will start performing the activities requested by the end-user which is also called client-side activity. By measuring client-side activity, we can also calculate Browser Rendering Time.
Common mistakes we make while building the Performance Test Scripts
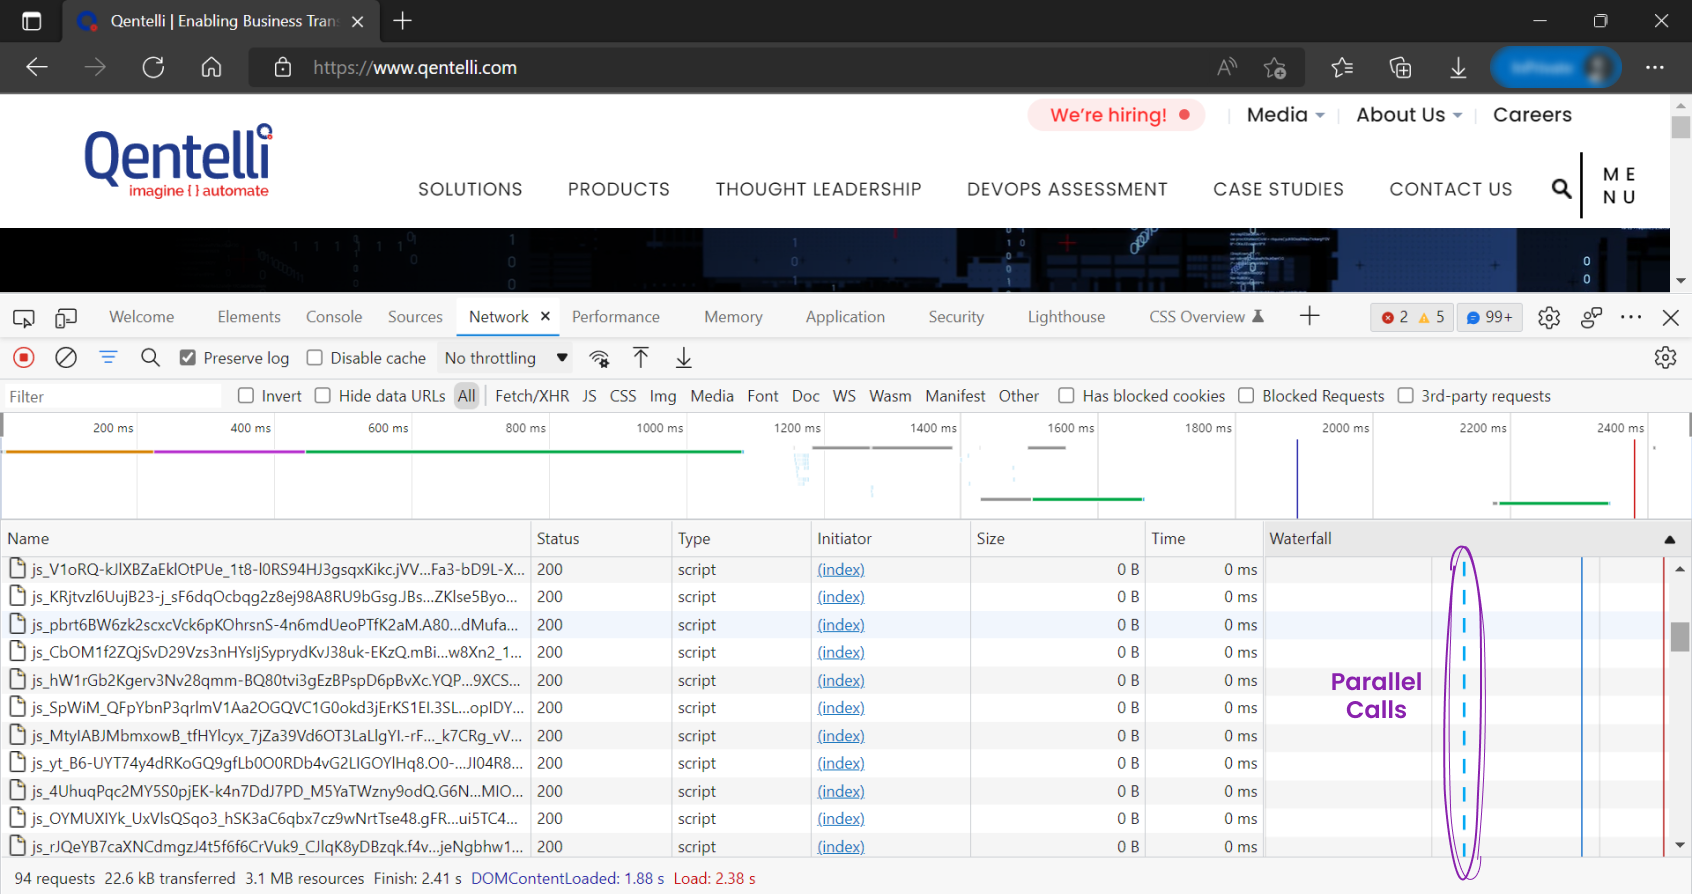
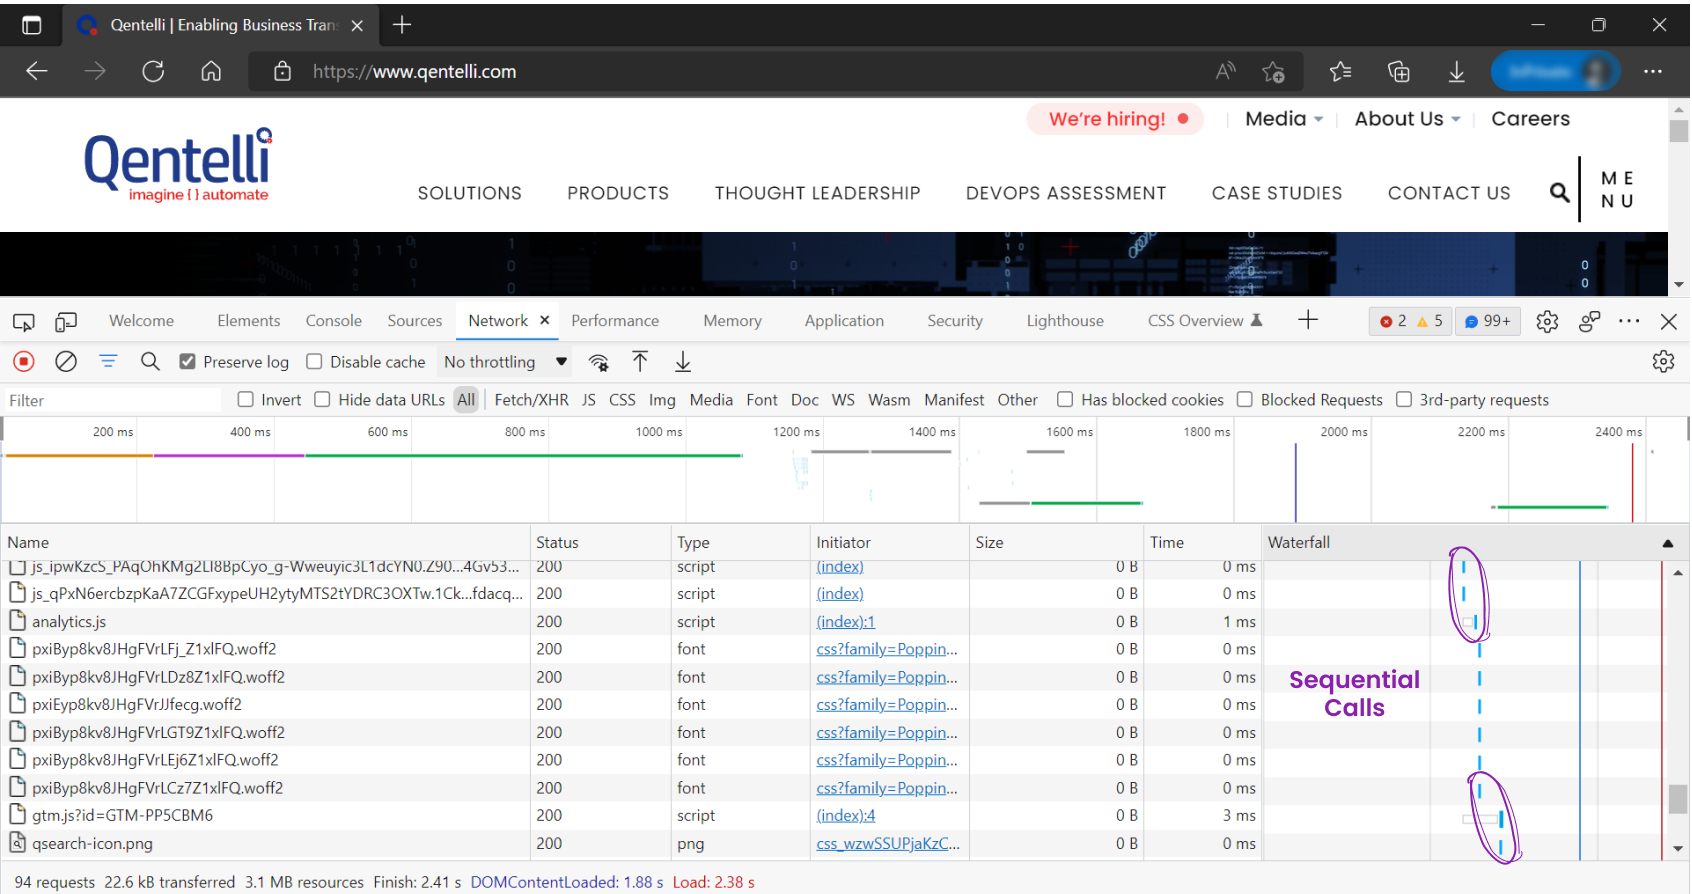
- Running all the Static Resources in a sequential manner
It’s very important to understand that making multiple requests simultaneously to the server from the tool only results in poor simulation. If your application is designed to accept multiple calls in parallel and you have designed the script to send those calls sequentially then you might report a higher response time compared to the real data. That’s a false positive. Similarly, if you design your test script to send the requests in parallel and application is designed to accept the request sequentially, then there are chances the script will fail or publish bad response time compared to real response time. That’s a false negative.
- Deleting or Commenting Static class while building the script
Deleting all the Static Resources is the right step, only if you are using the option ‘Turn ON’ as mentioned in point #3. Because in that case, you are not sending specific static requests to server. Instead, you are instructing the load testing tool to perform those operations.
- Using hard-coded data in every request
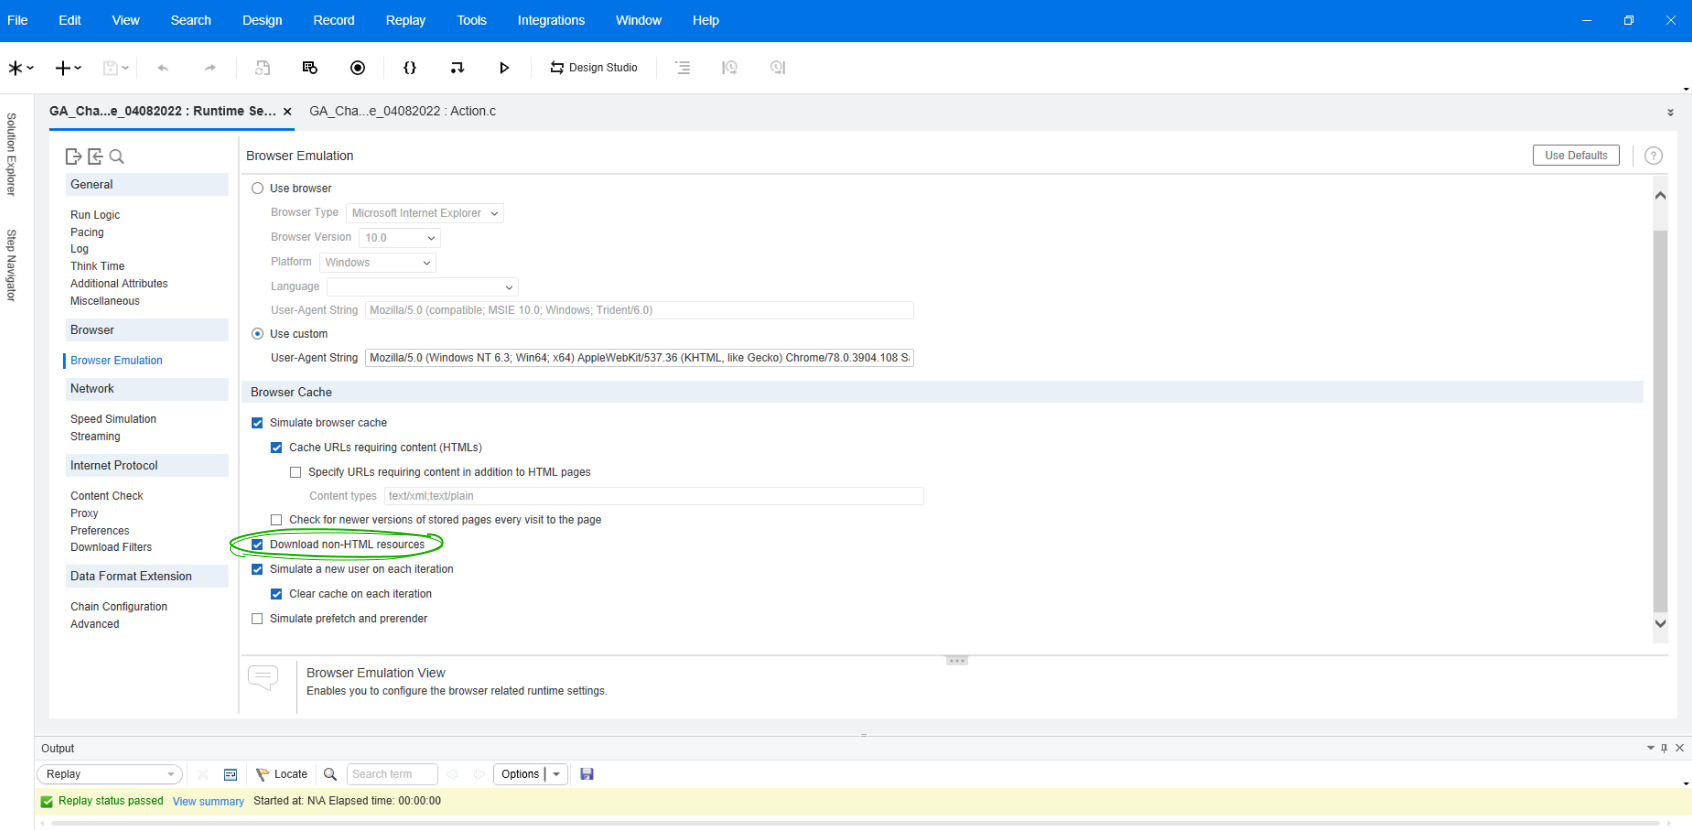
On/Off ‘Download non-HTML resources’ option in load runner’s run-time setting. [Tool - Load Runner]
(Or)
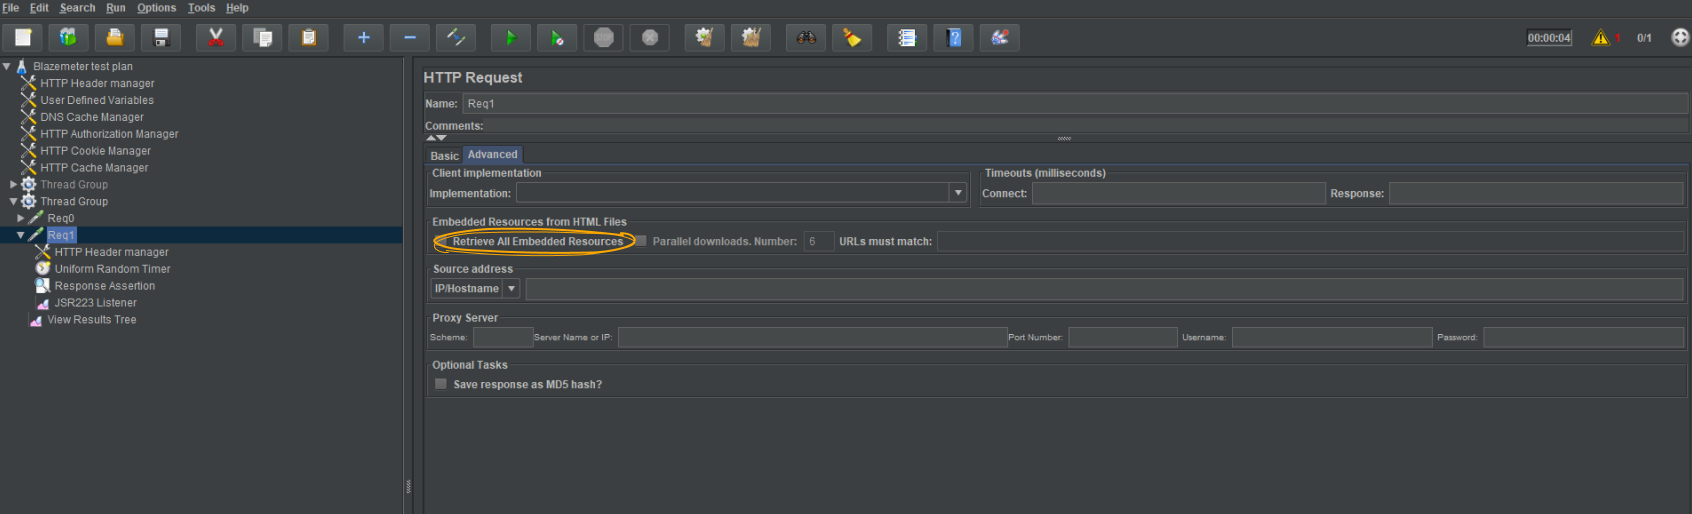
On/Off ‘Retrieve all embedded resources’ in the Advanced tab of the HTTP request. [Tool - JMeter]
Keeping the Static Resources in the script and having the option ‘Turn ON’ all the time is not a good approach as it indicates that you are requesting the same resource twice. It is always advisable to switch the setting between ‘ON’ and ‘Off’ based on your script calls.
Browser Rendering Time vs Resource Download Time
It is quite common for novice test engineers to get confused between Download Time and Browser Rendering Time. Former is about the amount of time it takes for a web page or application to download a file to the user's browser, and the latter is about the amount of time it takes for a page to load or reload.
On the other hand, Transaction Response Time would require us to calculate both - Browser Rendering Time & Resource Download Time. This metric is usually defined by the business or performance expert or mutual agreement on business requirements.
To get into more details, first we should know the test objectives.
Case 1: Business is interested to know only the Server Response Time.
Here, the objective of the Performance Test is to understand the performance of Server instead of focusing on the browser’s activity. Most of the Load testing tools support this activity and purely work on request & response concepts.
Example tool & Protocol: Load Runner, HTTP Web protocol
Drawback: While measuring this metric, we would not be able to find out any kind of browser rendering issues.
Case 2: Business is interested to know Transaction Response Time.
This objective requires us to monitor Reading Time as well. The business is interested to know how much time it takes for end-user to see the web page. In this scenario, we do not need to calculate the Server Response Time or Browser Rendering Time separately.
Let’s take an example of load runner TruClient protocol. TruClient protocol works on user interface events. It identifies the available objects on the UI and tries to perform action very similar to end-users.
Drawbacks:
- TruClient protocol is more expensive compared to web protocol
- TruClient script is not reliable compared to web protocol
- TruClient is resource-intensive. It works as a Process instead of Thread so it needs more CPU & Memory to run
Case 3: Business is interested to know the Server Response Time and Browser Response Time.
This is one of the best approaches to test your Applications/Server for Browser Rendering Time.
It is ideal because once you get data on these two metrics, you would have complete details of the current state of your application. Here, I would recommend going with HTTP web & TruClient protocol to achieve optimal results.
Let’s assume the below scenario.
Webpage: www.qentelli.com
Critical business scenario: Launch -> Click on ‘Careers’ -> Click on ‘Click here to know all the open positions’.
Test objectives:
- Server Response Time
- Browser Rendering Time
User Load: 50
Scripting:
I would like to prepare two performance test scripts for the same business flow with two different protocols.
- Web (HTTP/HTML) Protocol – This will help me to determine the Server Response Time
- TruClient Protocol – This will help me to get end-to-end Response Time (I.e., Server Response Time & Browser Rendering Time).
Execution:
I would like to simulate a scenario with two created scripts and distribute the load
Script | User Load |
Web (HTTP/HTML) Protocol script | 49 |
TruClient | 1 |
Total | 50 |
Based on the above load model, we can perform a load test of 50 users and get below response times.
- Server Response Time (From Web script)
- End-to-end response time (From TruClient script)
- Browser Rendering Time = (End-to-end Response Time) – (Server Response Time)
Conclusion
Performance assessments are not just about the number of tests but the quality and accuracy of test scripts. They determine the readiness of application, business reputation, and can impact revenue if taken lightly, etc. If we did not focus on the right approach, then there is a high chance of publishing the incorrect data which would mislead the decision-making process.
Do you want to up your Application’s Performance game? Drop us an email -> info@qentelli.com

