An international media and entertainment mammoth partnered with Qentelli seeking a solution that can correlate data from multiple tools they use to turn it into Business Intelligence.
Business Vertical:
Mass Media and Entertainment
Region:
USA
Size of the firm:
Large
Main Challenge:
Data Correlation and Business Intelligence creation

Challenge
No Single Source of Truth – The client has various teams with in their SDLC using multiple tools and dashboards yet lacking real-time insights to aid effective business decisions
Disparate Metrics Visualization – The leadership team was unable to acknowledge how the metrics were affecting them
Data Correlation – Unable to correlate data and visualize patterns from multiple different tools
Custom Thresholds Setup – Unable to setup thresholds that are practical and work for their teams
Custom Metrics – It was getting tougher to define (new) metrics with data from various sources
Lack of Actionable Insights – Although the client banks and generates a great deal of data, they were unable to make decisions from what they are tracking
Solutions Proposed
The client is an American-based and an international mass media conglomerate who is one of the world's leading producers and providers of entertainment and information.
As part of their business-as-usual, the client uses a myriad of SDLC tools and which are dealing with a gigantic pool of data and producing new data as they go. Naturally it became a tough task to make sense out of all the data and the client feels they are missing out on important business intelligence.
After a careful examination of client’s existing tool stack, vendors & infrastructure; Qentelli’s Data Engineers have suggested its high time they step into Advanced Analytics, Data Storytelling, Cataloging and improving Manageability as their tool stack is growing bigger year after year. That is how TED came into the picture.

What Qentelli Did:
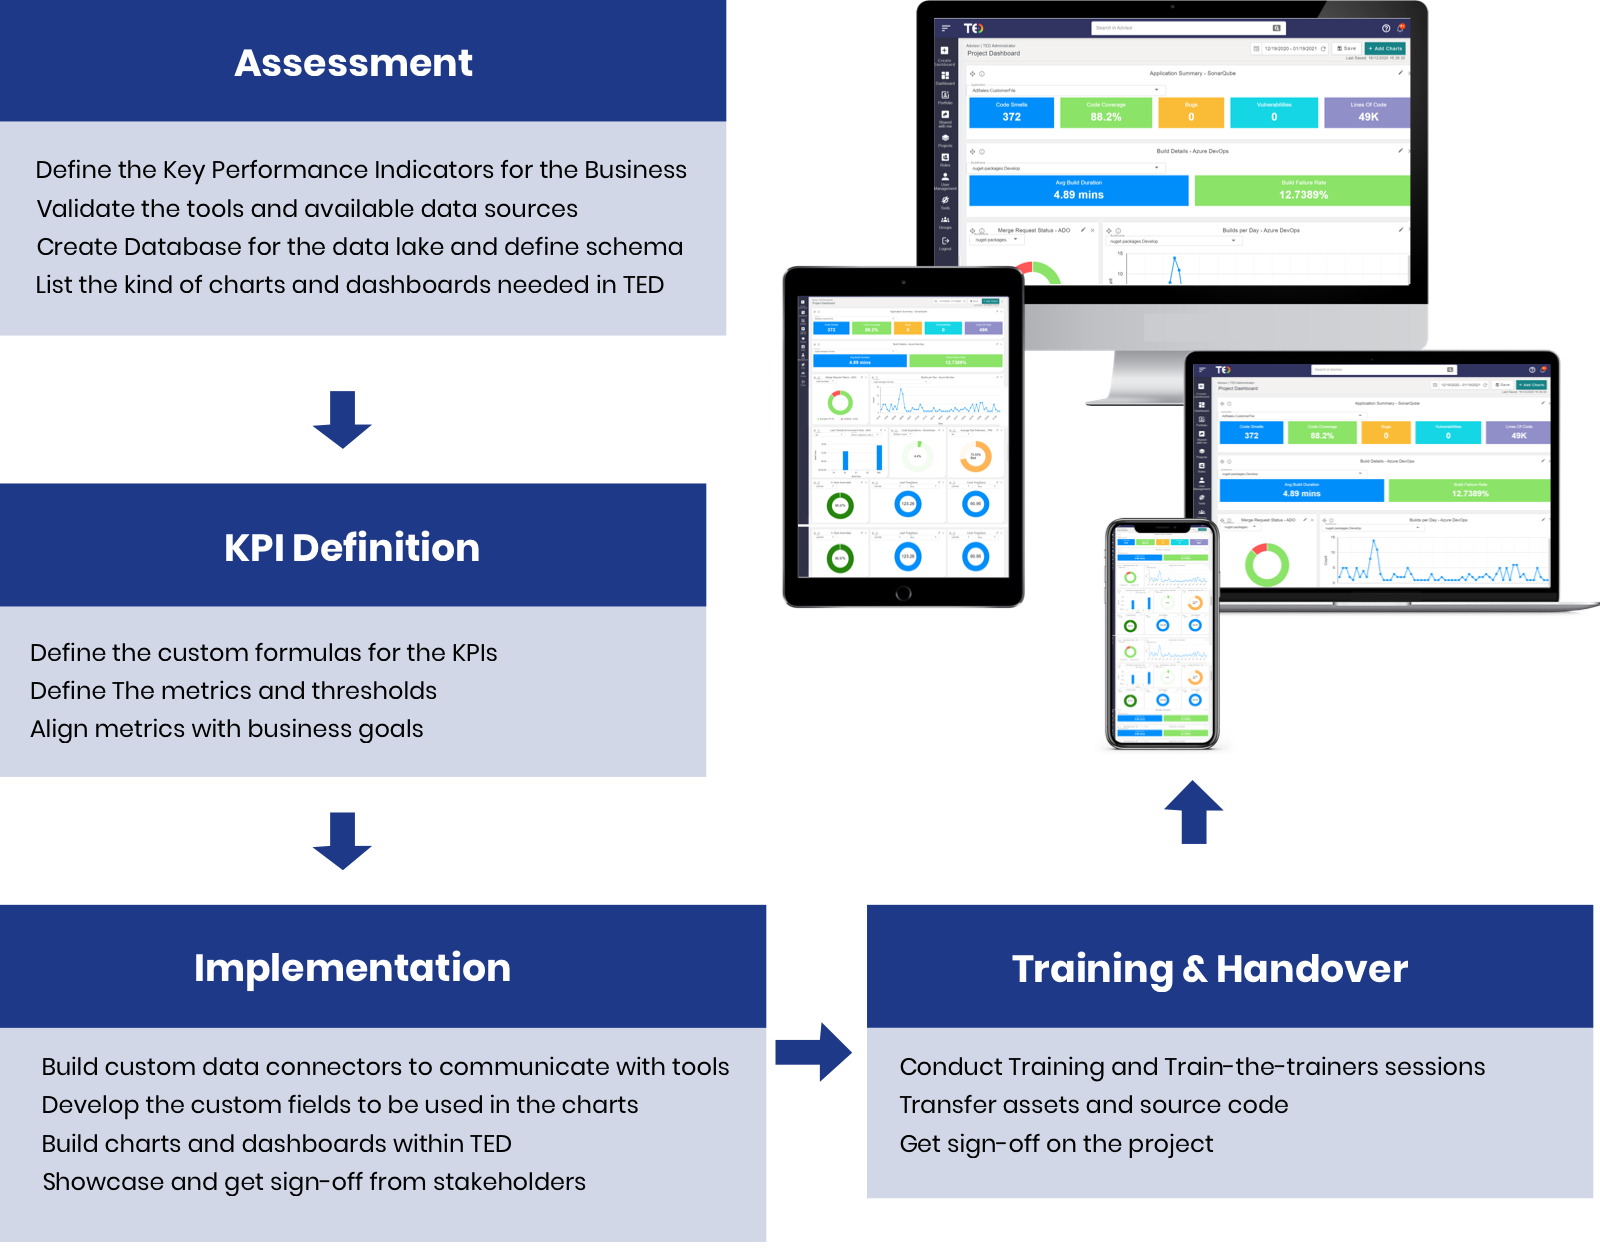
Assessment
Defined the Key Performance Indicators (KPIs) for the Business and validating the tools and available data sources. Created Database for the data lake and defined schema of sources and targets all the way through to business classifications in a glossary and maintained as a formal data dictionary. Designed and listed the required charts and dashboards in TED.
Here are some of the tools the client is using and would like to correlate the data from -
![]()
![]()
![]()
![]()
![]()
![]()
![]()
![]()
![]()
![]()
KPI Definition
Defined the custom formulas for the KPIs. Defined the metrics and thresholds while aligning all the metrics with business goals.
Implementation
Built custom data connectors to seamlessly communicate with tools. Developed the custom fields to be used in the charts. Built completely customizable self-explanatory charts and dashboards within TED. Every improvement was showcased and signed off by all the stakeholders involved.

Training & Handover
Conducted well-designed training sessions and Train-the-trainers sessions. Transferred all the assets and source code for further improvements and scaling purposes before getting the final sign-off on the project.
Outcomes
50%
Faster MTTR
40%
Improved MTTD
40%
Improvement in Lead Time
Build Progress Health is improved. The client is now able to correlate how the build progresses through various phases of testing and deployments and track failures quickly and reduce MTTD.
Created Dashboards for various roles. Along with the Engineering teams, the Business teams also have a single source of truth on how the team(s) are performing and identify bottlenecks.
Enabled Data-driven Decision making. With custom metrics and data correlation from various tools, the client is gaining actionable insights which led to faster and informed decision making.
Talk to an expert
Advance Your Business with Our Digital
Innovation Expertise
Demo


