
The success of any digital business relies heavily on its underlying infrastructure. Performance monitoring is key for every digital business to aid cost optimization and the absolute utilization of resources. Keeping track of Infrastructure KPIs can drive the growth of any digitally-enabled business.
From capacity planning to business impact analysis, decision-making in every crucial step requires supporting data in software development. KPIs or Key Performance Indicators are the guiding light that ensure you reach the end of the road, overcoming all the hiccups; they are the blueprint on which a project’s success depends. With the changing demands of the business and the digital transformation that is taking over several industries, an organization needs to keep up by re-evaluating the metrics that define the success of its products and services.
For smooth execution of the intricate process of software development and the different stages it entails, you need to tailor your trackers to reflect your end goals while ensuring that they reflect the actual thresholds critical to your business’ performance. Project managers and business leaders always tend to be on their toes, looking for opportunities to improve their team’s performance and success rate of the projects. Picking the right KPIs for their teams is integral in that process.
Map before Measuring; Align before Assessing
Fostering positive changes to enable valuable results for a digital business is easier said than done. With the rapid acceleration of digital transformation and new technologies popping up in the market regularly, your job as a business leader is to make digital initiatives your top priority while ensuring they incur tangible profit. But the first step to enable this should be mapping and alignment of the short-term and long-term goals you wish to achieve through the transformation.
Once you prioritize your digital initiatives, the next move is to identify opportunities that can create visible added value to your team’s performance, which will translate into successful projects. Planning your resources and investing in bold digital initiatives that not only focus on infrastructure maintenance but also performance improvement is the only way that will lead to meaningful business value creation.
At a broader level, identify your objective and plan your KPIs accordingly.
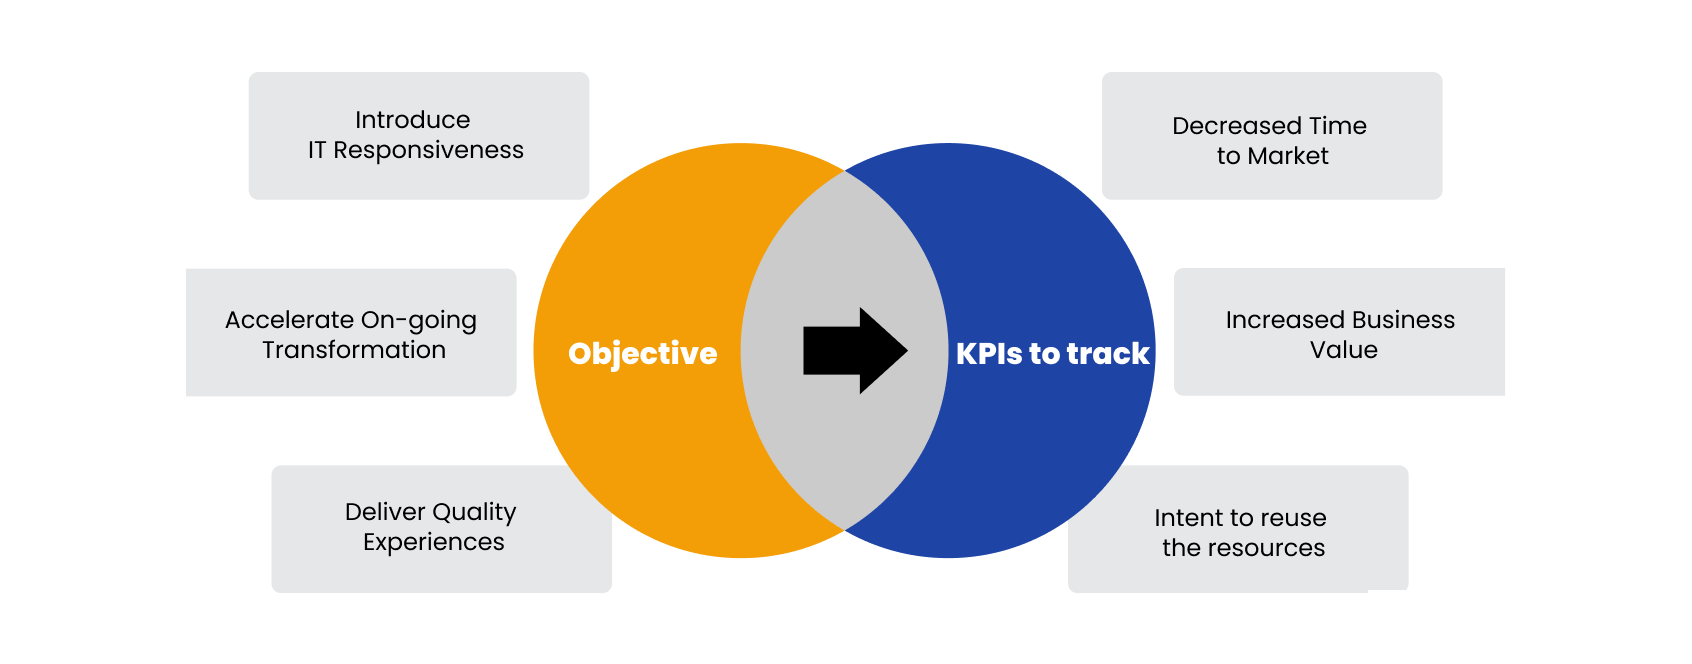
Once you have curated a map of impactful initiatives and they are aligned with the long-term goals of a business project, you can start thinking about the scale on which you will measure the success of your team and the quality of the product or service they are working on.
To make your life easier, we’ve put together a laundry list that extensively covers the KPIs you could utilize to measure, manage, and meliorate the software development life cycle that fuels your digital business.
DORA Metrics
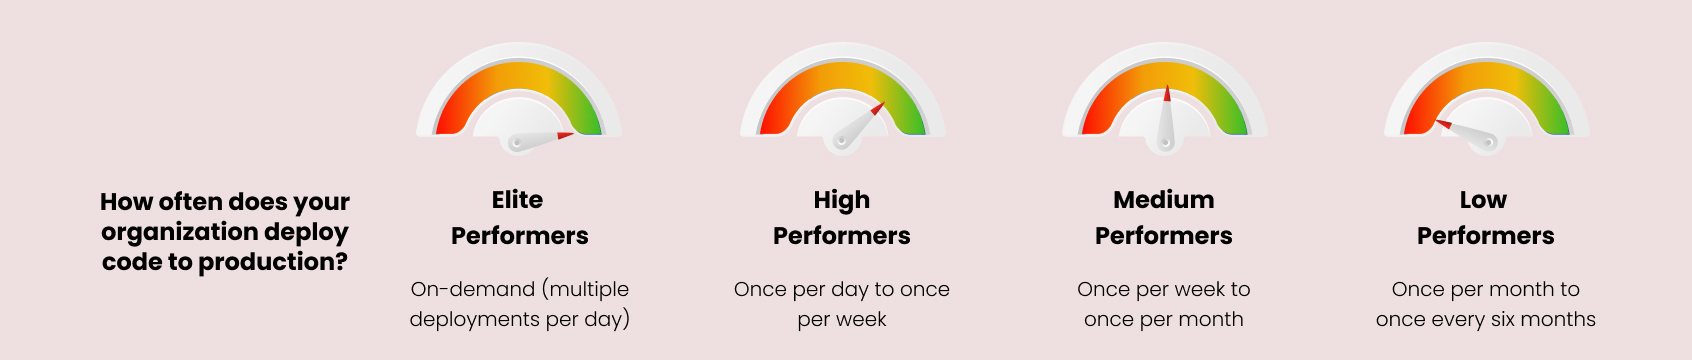
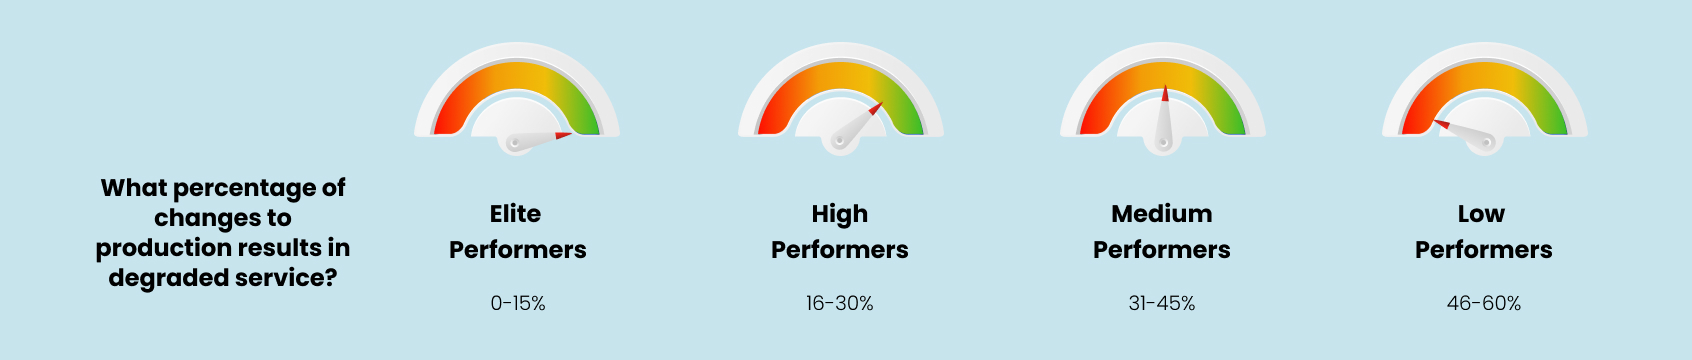
A team of 32000 professionals pooled in by Google Cloud called DevOps Research and Assessments (DORA) conducted surveys for six years and came up with the framework now known as DORA metrics. It defines the success of software development teams and DevOps companies by classifying them on a scale of low, medium, high, and elite performers. There are four prongs to this approach that assess the quality of DevOps performance:
Deployment Frequency: This KPI tells us the frequency of successful releases of the software to users or deployment to production.
Deployment Frequency = Total number of deployments / Total time
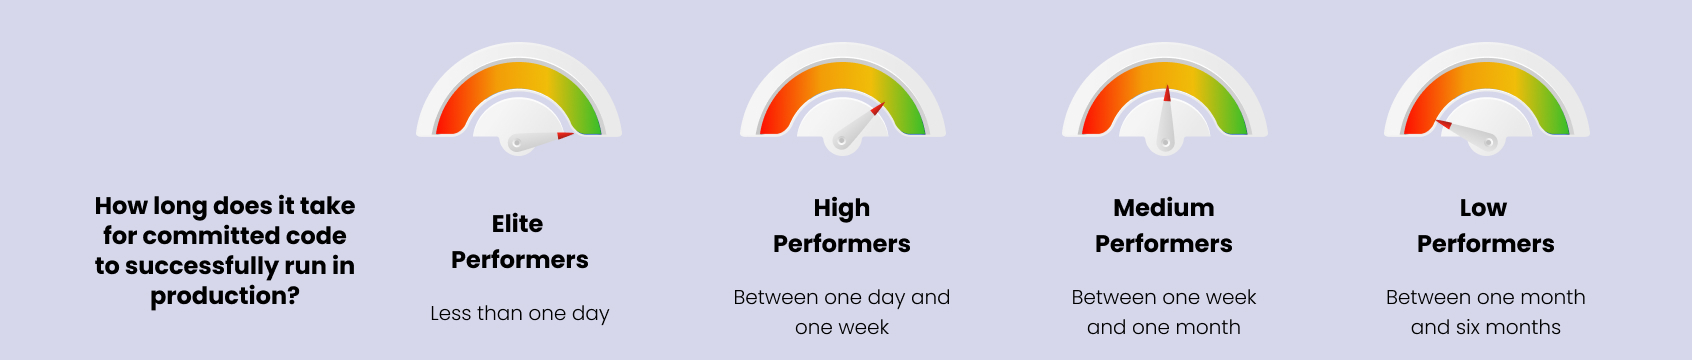
Mean Lead Time for Changes: This refers to the amount of time it takes for a code change to go from its commit state to being deployable or from being in development to being in production.
Mean lead time = total lead time / number of changes
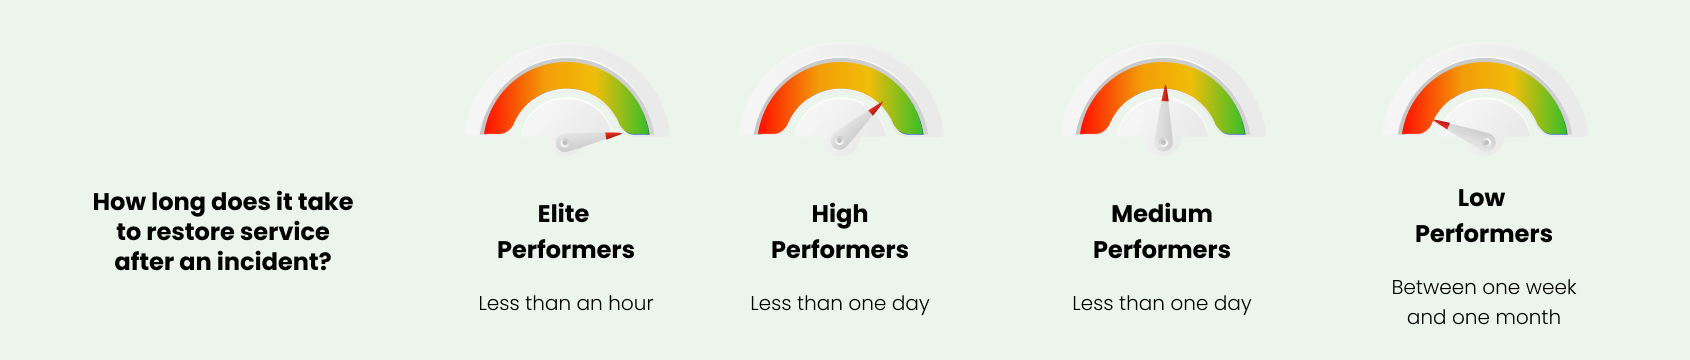
Mean Time to Recovery/Repair: MTTR is the interval between a deployment or system failure-related interruption and full recovery. The formula to calculate it is the total unplanned maintenance time spent divided by the total number of failures experienced.
MTTR = total downtime / number of failures
Knowing how soon we can go back on track when there is a breakdown is important and so is knowing how often the system is derailing. So MTTF is a good addition to MTTR.
MTTF = Total hours of operation / Total assets in use
Change Failure Rate: Change failure rate is the frequency of failures post-code deployment caused by the team’s changes or hotfixes
Change Failure Rate = Number of deployment failures/ Total number of deployments * 100
DORA metrics were established in 2014 and have gained considerable momentum and popularity while creating a paradigm shift in the industry. But other than DORA, there are other methods that quantify and measure how well your engineering team’s infrastructure is flourishing.
Gartner went a step beyond and published 15 Infrastructure KPIs for Digital Business Transformation which highlighted three categories through which a business can define its success while gathering insights on the state of its digital business. The first category is speed and agility, which is often hindered by a bad state of infrastructure. The second involves customer experience and centricity which should be one of the most important qualifiers of how well your business is faring. Digital businesses are eventually discovering that customer experience should be a simple and smooth process and that business partners should get their money’s worth. The third category involves deciphering your workforce’s skill set and mindset.
Here are the metrics to track in order to ascertain your team’s performance in each category:
Enterprise Speed and Agility
- Minimum Viable Product Release Frequency
- Handoff Minimization Score
- Before and after cloud comparison
- Automated vs manual change ratio
- Defect-based release quality
- Mean time to recovery
- Cloud cost efficiency
Customer centricity
- End-to-end service line health impact
- Infrastructure service value scores
- Customer effort score
Workforce transformation
- Emerging skills growth
- Skills change velocity index
- Versatile Experience score
- Digital dexterity distribution
- Digital Skills Recruitment velocity
With the multitude of KPIs available at every business leader’s fingertips, it can get a little confusing to pick the right ones that will optimize your project’s results. The best way is to determine your goals and objectives and have an approach that fits the bill of your project. Each endeavor will need different KPIs and it all depends on how well you are able to assess your project’s needs and customize the KPIs based on the requirements.
KPIs are the checkpoints on the map that will keep you on track and help you see the light at the end of the tunnel. With the ever-changing nature of technology and an increased focus on measurement and management of software development teams, businesses are going digital to observe their team’s performance through dedicated software. Platforms like New relic, Dynatrace, etc. are taking the market by storm and making a considerable impact.
TED – The Engineering Dashboard is an AI-driven Value Stream Intelligence product that provides you with industry-accepted KPIs out of the box such as the ones listed above and also allows you to create custom formulae that suit your specific requirements.
If you find any impediment in defining your team’s KPIs and are finding it challenging to map and measure, our team of experts at Qentelli can help you strategize and maximize the efficiency of any project you undertake. Simply send an email to info@qentelli.com to get in touch with us!
